Improving engagement on a travel content platform
Context
A travel information platform about Norway
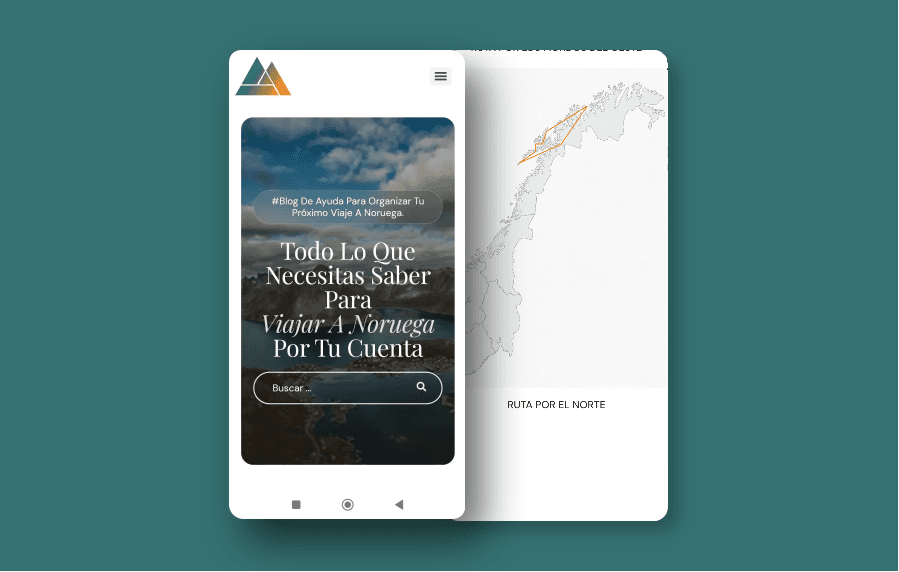
Noruega por tu cuenta is a travel blog created to inspire people and help them plan trips to Norway. The product is built on informational content and organic traffic.
My role was to analyze user behavior and improve the experience in order to increase time on site and interaction with the content.
Problem
Users were not staying
People reached the articles through solid SEO, but they barely moved through the content and left the blog quickly.
Goal
Increase time on page
Increase time on page, browsing depth, and retention by strengthening the content and introducing a new page architecture.
The metrics that would show the goal had been met were:
- Increase in pages per session
- Improvement in time on page
- More interaction with the content
Research
UX analysis
The following patterns stood out:
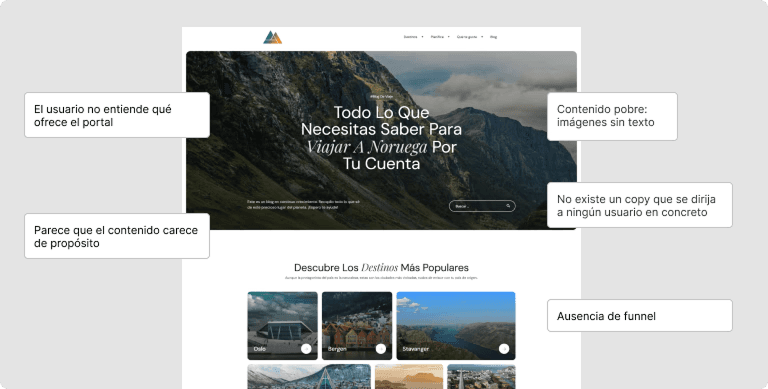
- Thin content: many images with text that added little value.
- Copy that did not address a specific user or their needs.
- Little internal linking between articles on related topics.
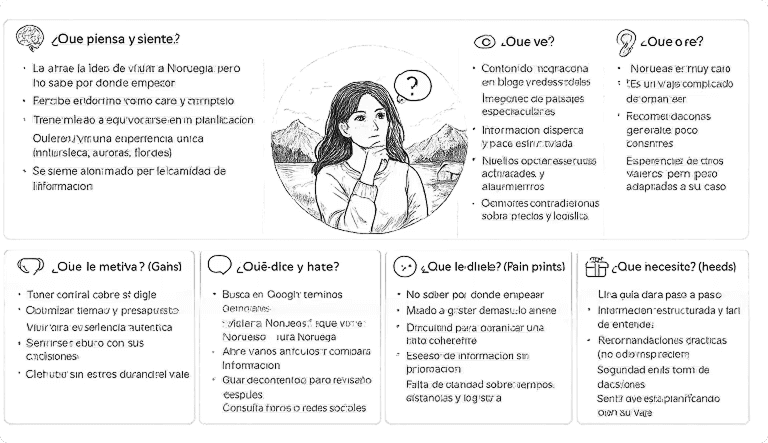
Empathy maps to understand the user persona
Because of that, I created an empathy map around the user’s pain points: How can I travel on my own? Is it very expensive? Will it be worth it? The content could then focus on those needs and pain points.
User story
Hypothesis
From the research and the findings, I defined the following hypothesis.
If the content structure improves and the page adds elements that make navigation easier, users will stay longer and interact more with the content.
Solution
Interface improvements
Homepage redesign:
- Redesign of the content structure on the home page
- Content that speaks directly to user needs
- New copy written for the user persona
- Scannable blocks
- Sections that invite further exploration (internal links)
01.
Copy rewritten to connect with the user’s pain points and make the value proposition easier to understand.
02.
Stronger internal linking, suggesting content and topics relevant to the user persona.
03.
Content recommendations based on the needs and interests identified in the user persona.
Validating the results
Results after the redesign
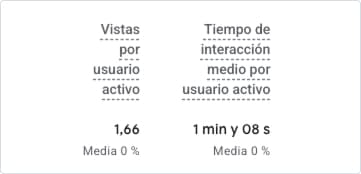
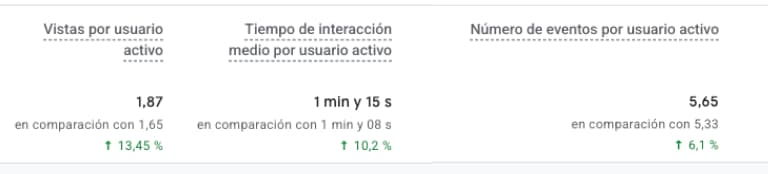
Three months later, I used Google Analytics to check whether the design changes had moved the metrics chosen at the start to show whether the goal was met: more time on site and more user interaction. The results are in the screenshot below.
Learnings
The results show an improvement in consumption and interaction, while scroll depth did not improve. The next iteration would look at which content causes the most drop-off and refine the structure of the articles.